The batch details document provides two views: the Batch Graph and the Events Grid.
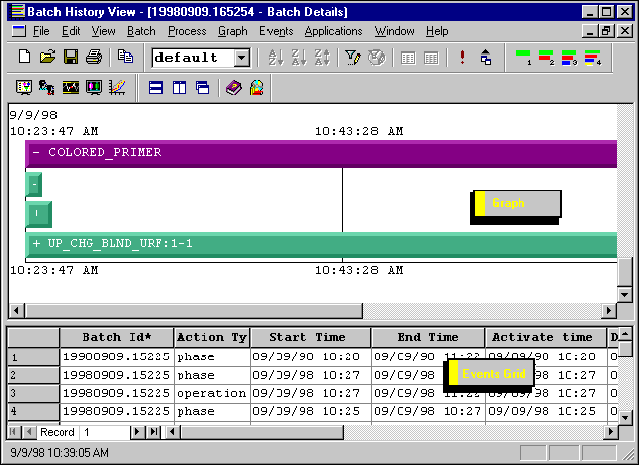
Batch Graph
This batch graph displays one batch’s progress as a bar graph. You can view up to four recipe levels (procedure, unit procedure, unit operation, and phase) on the bar graph. Use the menu item Levels to specify which levels are displayed.
Events Grid
The events grid shows batch related events in a tabular format. You can apply filters to limit the information and apply sort methods to order the information. Batch overview and Batch detail documents contain one grid, while batch comparison documents contain two grids (one grid for each batch). For a more detailed view of all events for a batch, select the batch and use the menu item .