Use this dialog to configure a worksheet function to retrieve filtered events from the Event Chronicle database for one or more shifts within a time period. The Event function retrieves Event Chronicle events from the active and all current event history data sets. To prevent duplication of events, it does not include events in the active data set that have been copied to a current data set, but have not yet been deleted from the active data set. The filtered data can include the following items related to each event:
When you use the Configure Events function, the Required Range for the array is not known until the data has been read, unless you enable the Maximum samples option. You can use the Try It button to determine the dimensions of the array needed for the returned results. For more information, see the description under Worksheet below.
For more information about the Configure Events Function dialog, refer to Worksheet Function Reference in Books Online.
The dialog contains the following areas:
Chronicle Node Enter or browse to the connection string for accessing the Event Chronicle database. This is the node name of the Event Chronicle server.
Period(s) Defines the overall time period and the maximum number of events for the analysis.
The Mode and Offset controls tell the Event Chronicle server how to interpret the times you specify.
Mode Select the mode for the start and end event timestamps: Local Time or GMT. If GMT, you can specify an offset in hours and minutes. If local, the timestamp is treated as being in the time zone of the client PC.
Offset If GMT is selected as the mode, you can select a time offset in +/-hh:mm.
Maximum events To specify a maximum, enable the Maximum events option and enter the maximum number of events you want to retrieve. Any events within the time period in excess of this number will not be retrieved. If you do not enable the Maximum events option, all available events will be retrieved. (In this case, the final argument in the function formula appears as "-1.") If you do not specify a maximum number of events, it is not possible to calculate a required range value unless you first use the Try It feature. In this case, the Required Range will show 1 row for data and 1 row for the header (if enabled); the Extra row(s) feature can be used to expand the selection beyond these two rows even without using the Try It feature.
For more information about the maximum boundaries of a worksheet, refer to Use the Worksheet Functions.
From Defines the start of the time period.
Date/Time The timestamp of the start of the period you wish to examine. This allows selection of date/times with precision of 1 second.
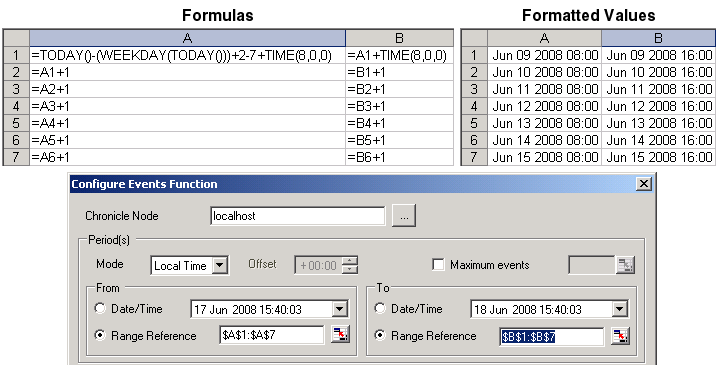
Range Reference By entering timestamps in a range of worksheet cells, you can specify a series of start and end-time pairs with cell references. In this way, you can specify timestamps in standard Excel format, up to millisecond precision, to define scenarios such as, “events from the 8:00 a.m. to 4:00 p.m. shift for last week.” The picture under Example below illustrates how you could enter formulas into a series of cells to define this scenario, and then specify $A$1:$A$7 as the start time as a Range Reference.
Note If the start time of the specified time period is later than the end time of the specified time period, events are retrieved in reverse chronological order from the (later) start time toward the (earlier) end time.
To Defines the end of the time period.
Date/Time The timestamp of the end of the period you wish to examine. This allows selection of date/times with precision of 1 second.
Range Reference By entering timestamps in a range of worksheet cells, you can specify a series of start and end-time pairs. In this way, you can specify timestamps in standard Excel format, up to millisecond precision, to define scenarios such as, “events from the 8:00 a.m. to 4:00 p.m. shift for last week.” The picture under Example below illustrates how you could enter formulas into a series of cells to define this scenario, and then specify $B$1:$B$7 as the end time as a Range Reference.
Example
Display Data Allows you to specify the requested data to be shown in the worksheet function results.
Header Row (check box) Indicates whether you want the returned data to include a header row that contains standard headers for each column. The text will be specific to the data in the column and any filters you select. If you require different column headings, clear this check box and enter the headings you require directly into the worksheet.
Columns Defines the columns to be included in the tabular results of the worksheet function. Each column definition is made up of the column name and, optionally, various filters relating to that specific column.
Available columns To add a column, select the column name and click the right arrow button. The standard Windows Shift and Control keys can be used to select multiple columns. Note that you can add a column to the results only once.
Selected columns To remove a Selected column, select the column name, and then click the left arrow button. The Up and Down arrow buttons can be used to rearrange the order of the columns.
Filters You must select each item in the Selected Columns list, and then click Filters to open the Filter Settings dialog box to specify filters either by selecting from a Browse List of available filters or by specifying a text string, including wildcard patterns, to define a filter setting.
Note If Timestamp is the selected column, an Attributes button appears instead of a Filters button. Click Attributes to open the Timestamp Attributes dialog, where you can specify Local Time or GMT.
Worksheet Use this section of the dialog to set up what will be an array formula in the worksheet. When you use the Configure Events function, the Required Range for the array is not known until the data has been read, unless you enable the Maximum events option. (It is limited to one row for the data and one for the column header, if that is selected.) Therefore, it is recommended that you use the Try It button to determine the dimensions of the array needed for the returned results. After closing the Try It feature's Query Results window, the worksheet Required Range is automatically adjusted to the required size. For more information about array formulas, refer to the Microsoft Excel online help.
Required Range Displays the dimensions of the array that will be yielded based on the current selections in the dialog fields. Use the Try It feature to determine the correct array size, as described above.
Current Range This field displays the current selected range and the dimensions of that range. If the range is smaller than the Required Range, then data will be truncated in the workbook, unless "Adjust selection to accommodate results" is used (see below).
Adjust selection to accommodate results (if necessary) If the Required Range is larger or smaller than the Current Range, use this check box (and the "Insert rows and columns" check box if necessary) to cause the dialog to adjust the current range when the OK button is clicked.
Insert rows and columns Use this check box (in combination with the "Adjust selection to accommodate results" check box) to set up a rectangular region of cells that will contain the results. Use this check box if the worksheet contains additional data below or to the right of the selected cell; otherwise, that data may be overwritten.
Extra row(s) This can be used to expand the selection beyond the current number of rows even without using the Try It feature. Select the check box and specify the number of rows to be added. This feature might be useful when creating a report definition file and the Event Chronicle database has fewer events than might usually be expected. For example, you may want your report to allow room for 25 events even though there only be five events that match your filters at the current time.
Try It Button Opens a grid view in which the results can be previewed. This dialog will show the real results from querying the Event Chronicle database. The Try It window shows the row and column at which the data will be inserted. (Thus, if the formula is inserted at B7, the Try It grid starts at B7.) The Try It window can be closed at any time to abort a query that is taking too long to complete.
OK Button Accepts your changes and closes the dialog. A tooltip for the OK button shows the formula that will be inserted when the OK button is clicked. Note that until all fields in the dialog are completed with valid values, the OK button is disabled. If a cell reference is used, the OK button is disabled if the referenced cell does not contain a valid value (for example, the referenced cell is blank or contains a date/time value for the Maximum events field). If the OK button is disabled, a warning icon appears on the OK button; a tooltip for the warning icon provides further information.
Cancel Button Closes this dialog without accepting the changes.