Trend links and trend charts

Add a 3-pen chart

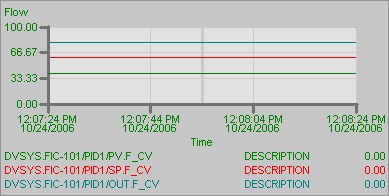
  1. Click the Chart button on the Toolbox, and then move the cursor onto the picture.

    The cursor turns into a cross-hair.

  2. Click the mouse and drag it to form a rectangle. (Refer to the illustration of the process graphic to size the rectangle.)
  3. Release the mouse button to place the chart on the picture.
  4. Select the chart and move it to the upper right corner of your working area.
  5. Select and right-click the chart, select Chart Configuration, and then click the Chart tab.
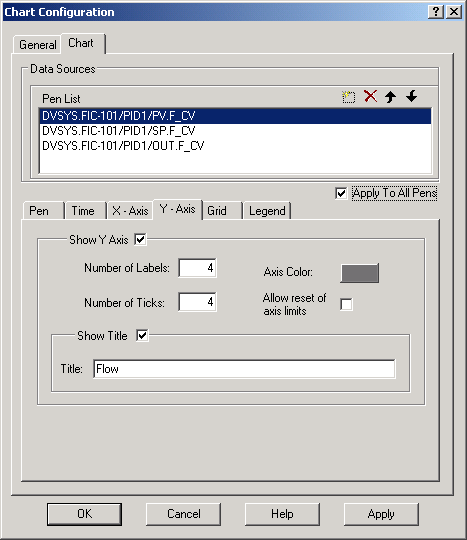
  6. To configure each of the pens with the following parameter paths, click the Add Pen button, and then select them from the pulldown list:

    DVSYS.FIC-101/PID1/PV.F_CV

    DVSYS.FIC-101/PID1/SP.F_CV

    DVSYS.FIC-101/PID1/OUT.F_CV

  7. Select and delete the default pen (FIX32.NODE.TAG.F_CV) from the Pen List area when you originally opened the Chart Configuration dialog.
  8. Click the Y-Axis tab, and then change the title to Flow.
  9. Enable the Apply to All Pens field.

  10. Click the X-Axis tab, and then change the title to Time.
  11. Take all other defaults or experiment with the settings, and then click OK.

    The chart is placed on the picture.

  12. Save the picture.