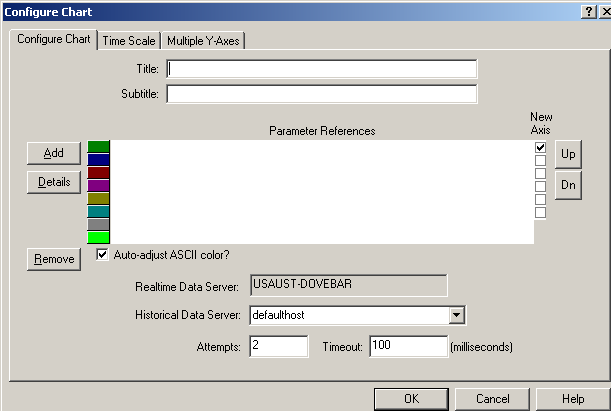
- Click the E +Chart button in the New dialog.
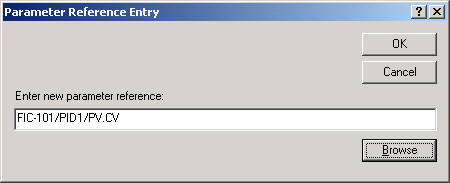
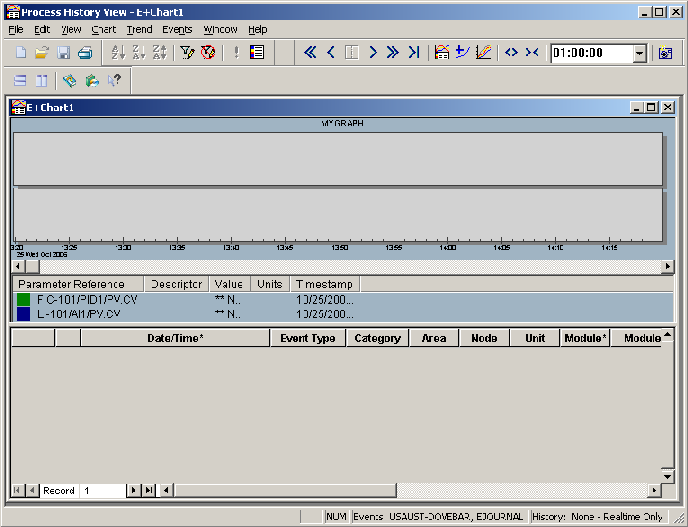
- Select Module Parameters in the Object Type field, and then browse in the TANK-101 area for FIC-101/PID1/PV.CV to plot the value of the outlet flow.
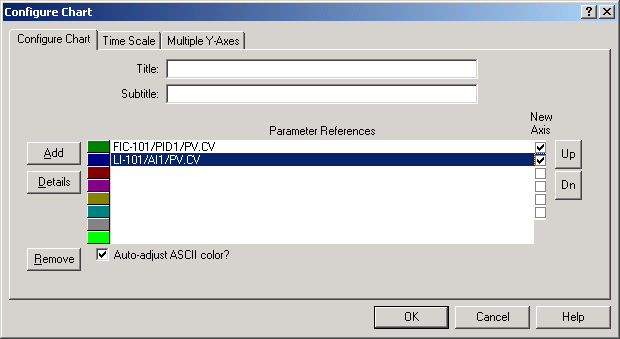
- Click the New Axis check box for LI-101/AI1/PV.CV.
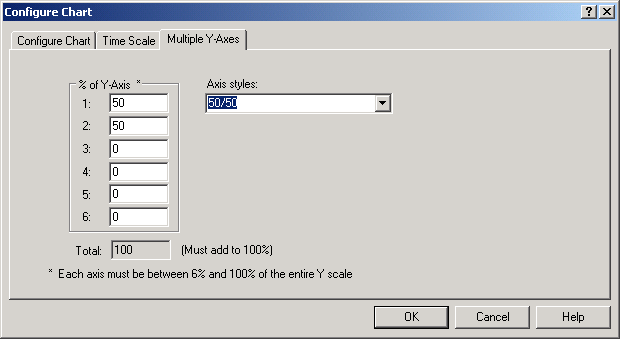
- Click the down arrow and select 50/50 in the Axis styles box to create two Y scales to plot the data values.
- Click OK to close the Configure Chart dialog.