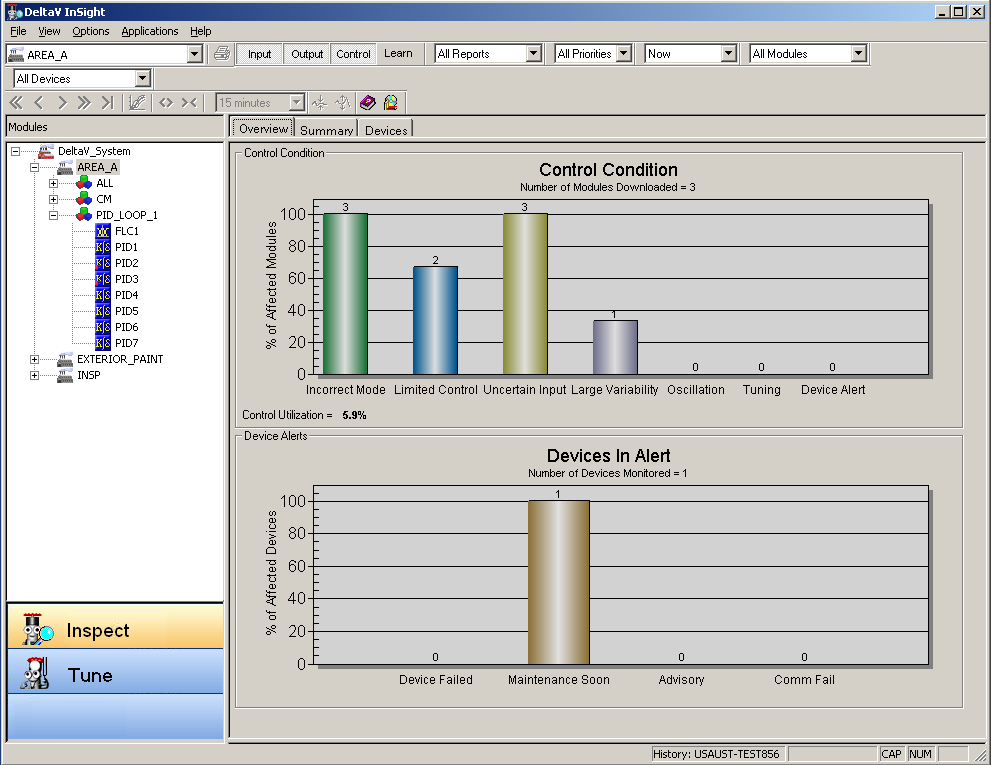
InSight performance monitoring does not require any configuration or setup. To use InSight for performance monitoring, click . The following figure shows DeltaV InSight opened to the Overview page.
Before InSight will recognize any changes or downloads of modules to a controller, you must download the controller setup data.
The first time that you access InSight for performance monitoring, it displays the number of modules active as 0 because, by default, no areas are enabled for data collection. To enable an area for Inspect, select the area in the hierarchy, and then click Enable Inspect for Area on the context menu.
The InSight user interface for performance monitoring consists of the hierarchy in the left pane and three pages: Overview, Summary, and Devices.
Overview Page
The Overview page includes a summary of the blocks that have one or more abnormal conditions and shows active device alerts. The Overview page contains the following sections:
Control Condition
This section graphically shows the percent of downloaded modules containing blocks that have abnormal conditions. The actual number of modules that have each of the abnormal conditions is listed on the graph. The Tuning value indicates the number of loops that would benefit from the Adaptive Tuning recommendations. The Variability Index is a measure of the quality of the control. The Oscillation Index, available when Process Learning is enabled, defines how a PV's signal resembles the oscillatory signal. It is assumed that the oscillatory signal may have a regular shape (sine or square wave) or an irregular shape. The area of each half period of oscillations is calculated. The oscillation index is calculated as the ratio of two successive areas, limited to 1. Oscillation index calculations are filtered to provide stable values. The index for an oscillatory signal with constant amplitude of the oscillations is equal to one; the index for a signal with decaying amplitude of the oscillations is less than one. The Device Alert value presents a summary of the information on the Devices tab. When an abnormal device alert occurs, the associated module or block shows a device alert. The Control Utilization values indicate the percent time the control was within variability and the control blocks were used as designed.
Devices in Alert Section
This section graphically shows the percent of devices monitored at each of the four alert levels: Device Failed, Maintenance Soon, Advisory, and Communications Failed. The actual number of devices at each of the alert levels is shown on the graph. The numbers include all devices (fieldbus or not) that are monitored for maintenance state.
The information of interest is the worst currently active alert level for the monitored device. For example, a device may have multiple alert levels active at one time but only the highest level will be reflected in the overview. For fieldbus devices, this alert information comes directly from the device's shadow block. Communications Failed is the highest priority for fieldbus devices; no other alerts are present when Communications Failed is Active. For nonfieldbus devices, add Diagnostic function blocks to modules to report device alerts.
Summary Page
The Summary page provides performance information and a summary of abnormal conditions for all modules or only for modules that have exceeded limits, depending on the setting you selected in the Filters area. When DeltaV System, an Area , or module is selected in the hierarchy, the Summary page shows overview information for the selection. For example, when an Area is selected in the hierarchy, the Summary page provides overview information for all modules in that area that contain I/O and Control function blocks. Modules containing I/O function blocks (AI, AO, DI, DO, and PIN) and Control function blocks (DC, FLC, MPC, NN, PID, and Ratio) appear in the Module Name list. Also, with the exception of the FFMDI, FFMDO, and FFMAI blocks, modules containing most of the extended function blocks appear in the Module Name list. The abnormal conditions that can be detected are abnormal block mode, limited control, uncertain input, and whether the limits for average variability index and oscillation index have been exceeded. The Tuning column indicates if the loop would benefit from the Adaptive Tuning recommendation. The Report column indicates if reporting is enabled or disabled for the block. Use the context menu commands to enable or disable reporting. When reporting is enabled on a block, information about that block is included in performance reports that can be exported from InSight and used in office applications such as Excel. Reporting can also be used as filtering criteria to limit the information shown on the Summary page. Similarly, to filter the information shown on this page, you can assign a priority (1-5) to modules and blocks. Use the context menu commands to assign a priority. The priority applies to modules and blocks below the selection. You can select multiple items on this page using the standard methods of multiple selection: shift-click and control-click. A grayed cell indicates that the condition does not apply to the block. Context menu commands are available from the module and block level. Use these commands to open Control Studio and Diagnostics from a module, to enable or disable Inspect for a module or block, enable and disable reports, and set a priority for a module or block. The following image shows the Summary page with an area selected in the hierarchy.
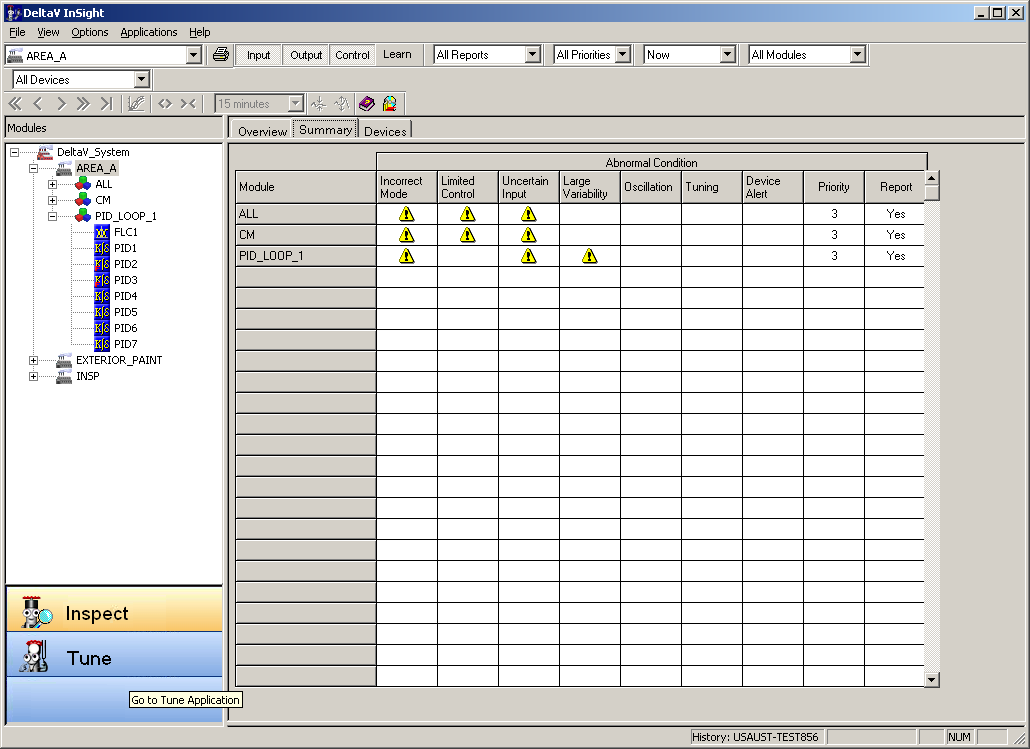
Modules are listed in alphabetical order. Select a module in the hierarchy to see performance information about the I/O and Control blocks in the module. If one or more blocks in a module has exceeded one of the limits, the associated problem is indicated by an icon. You can change the icon from the View menu. To see detailed information about a block, double-click the icon related to that block on the Summary page or select the block in the hierarchy.
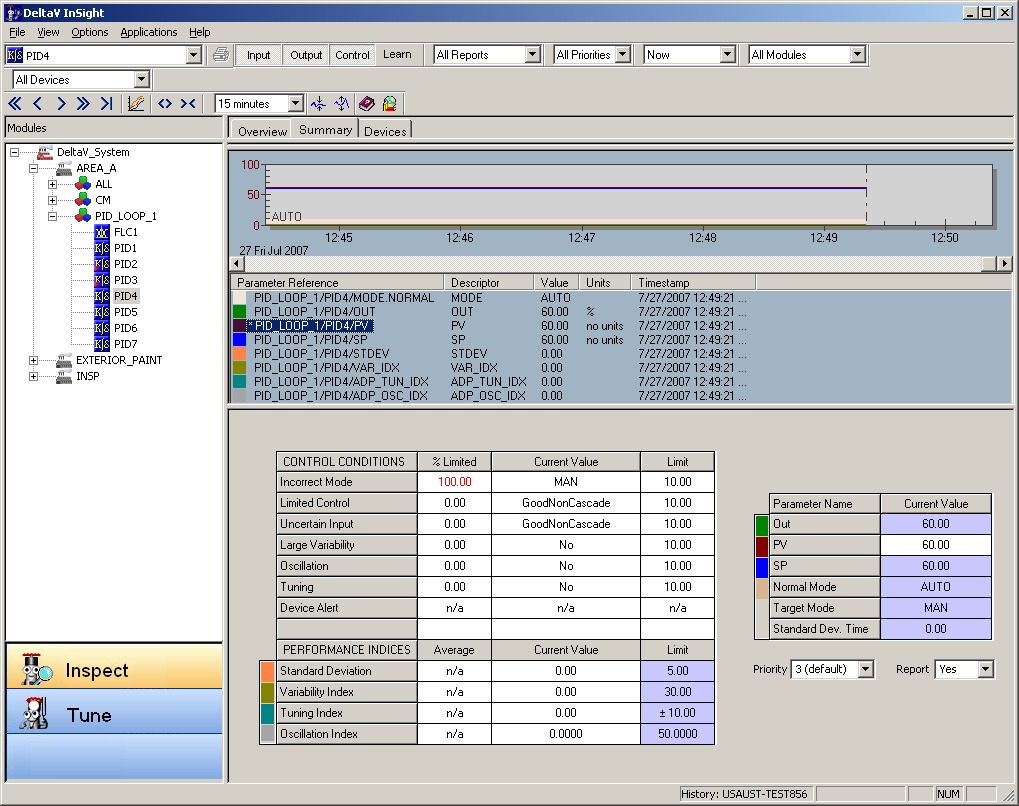
Use the information on the block Summary page to identify conditions causing the module to exceed its limits, as well as the percent of time that the condition was abnormal.
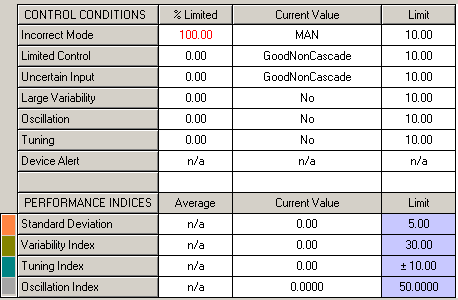
Control Conditions
The % Limited column shows the percent of time that an abnormal condition has existed during the currently selected time frame. If the % Limited value exceeds the number in the Limit column, the value in the % Limited column is shown in red. This condition also causes the exceeded icon to be shown on the area and module summaries for this block. The limits shown in this area are global limits that apply to all blocks. Conditions not applicable to the currently selected block are marked n/a. Oscillation and Tuning are only applicable when Process Learning is enabled on the block. Device Alert is only applicable when the block is assigned to a fieldbus or HART device. Variability is based on Variability Index and Standard Deviation.
The MPC, MPCPro, and Neural Network (NN) function blocks have multiple input and output values that can cause limited control or uncertain input conditions. For these multivariable blocks, the Inspect application is unable to display the current value of the parameter that is causing the limited or uncertain input condition and displays n/a in the Current Value column and active values in the % Limited and Limit columns. To identify the source of limited control or uncertain input for multivariable blocks, use the blocks' engineering or operator applications such as PredictPro or MPC Operate Pro.
Performance Indices
The Average column shows the average values for the selected time frame. Indices not assigned to the Continuous Historian are marked n/a. Averages are calculated on the Current and Previous time frames. Averages are not calculated on the Now time frame. Conditions not applicable to the currently selected block are marked n/a. The Oscillation and Tuning indices are only applicable when learning is enabled on the block. The limits shown in this area only apply to this block.
The Easy InSight History Collection command simplifies history assignment by adding the control performance indices (Standard Deviation, Variability Index, Tuning Index, and Oscillation Index) to the Continuous Historian's history collection for the selected block. To access this command, expand a module under an Area in the DeltaV Explorer and select the command from the block's context menu. By default, this command uses a history sampling period of 60 x module execution rate. Be aware that if the block scan rate is greater than the history sampling period, it is possible to collect history multiple times per block and clutter the historian with unnecessary data. It is recommended that you manually adjust the historian sample rate if you use the Easy InSight History Collection command with a block running at a scan rate greater than 60 x module execution rate. To manually adjust the sampling rate, select the Continuous Historian in the DeltaV Explorer, and then select History Collection from the context menu.
You can modify the trend for a block parameter by selecting the parameter in the Legend. Click to view the Legend.
The current values for the selected block's parameters (Out, PV, SP) as well as the Normal and Target modes and Standard Deviation time are provided in the table in the lower-right corner of the Summary page.
Write to Inspect Alarm
The Write to Inspect Alarm command is available from the Summary page. Select and right-click a block to access this command.
When this command is selected, the block's INSPECT_ACT parameter will trigger the Inspect block alarm if Inspect is enabled and one or more of the block limits have been exceeded. The Inspect block alarm is triggered if both of the following conditions are true:
- The Write to Inspect Alarm command has been selected from InSight for this block.
- With the "Current Hour" filter selected, InSight indicates that an abnormal condition exists for Mode, Control, Input, or Variability. Note that an abnormal condition exists for Variability only if both the Variability Index and the Standard Deviation have exceeded their limits.
To assign the INSPECT Block Alarm, select the block in Control Studio, and then click Assign Alarm on the context menu.
Devices Page
Select the Devices tab to display the Devices page.

The Devices page provides a list of field devices that have abnormal alert conditions. Filter selections are available to show all devices, devices in alert only, fieldbus devices in alert only, or none. The time frame is always Now for information shown. The Devices page lists the device name (or the associated Diagnostic block name for nonfieldbus devices) and the active alert conditions, if any, for each device. Right-clicking a block or device opens a menu from which you can open the appropriate detail analysis application, if one exists. If a fieldbus device is selected, you can view the device status with AMS Device Manager software.
Selecting Items to Monitor
InSight monitors all I/O and Control blocks that are downloaded to any DeltaV plant area, process cell or unit module that has been enabled through the InSight interface.
InSight limits the number of blocks it watches to 10,000. The system prevents you from enabling an area that would add enough blocks to exceed the limit.
To enable and disable InSight performance and utilization calculations, select the area, process cell, or unit module and select a command from the context menu in the Inspect hierarchy.
For those modules that are contained within an area assigned to InSight, the software automatically includes all of the I/O function blocks (AI, AO, DI, DO, and PIN) and Control function blocks (DC, FLC, MPC, PID, and Ratio) as long as those modules have been downloaded to a DeltaV controller. As modules are added or deleted, InSight detects these changes. In other words, no module-level configuration is necessary for tags to be included in InSight. You can enable and disable performance and utilization calculations for individual modules by selecting the module in the hierarchy and using the context menu commands.
Note that if you disable all the blocks in a module and have the Filters area Modules toggle set to Limit Exceeded Only, the module you disabled disappears from the Module Name list. To make it reappear, set the Modules toggle to All Modules.
Using the Context Menu Commands
Context menu commands are available from all levels in the InSight hierarchy. The context level commands vary depending upon the item selected. To use the context menu commands, select and right-click an item in the hierarchy. From the DeltaV system level you can:
For modules, you can use the context menu commands to:
For blocks, you can use the context menu commands to:
Filtering Items to Monitor
The filter settings you make help determine what modules and blocks are included in the performance and utilization calculations. You can filter by time period, block types, report status, priority, device status, and module status. You can set filters from the Filters dialog which is accessed through the Options menu or from the InSight Toolbar. The filter selections from the toolbar and dialog are the same; the only difference is how they are accessed.

The following section describes the filter selections when accessed from the Filters dialog There are three areas on the Filters dialog: Time Filters, Control Filters, and Device Filters.
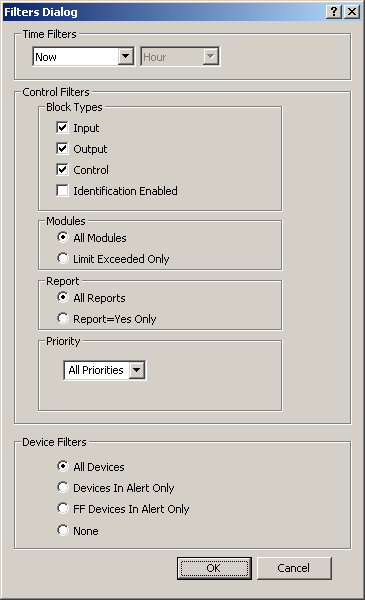
There are two time filter pulldown lists: Time Frame and Time Window. The choices for Time Frame are Now, Current, and Previous. The choices for Time Window are Hour, Shift, and Day. If you select Now, the Time Window options are not available and the InSight performance monitoring view shows the instantaneous parameter values of the block and uses these values to determine if a module is in the Module list. By combining selections in the two lists you can filter the data for the following time periods:
In the Block Types area, select one or more types of blocks to include in the InSight window. To display only Control blocks with Process Learning enabled, select Identification Enabled only in the Block Types area. When Process Learning is enabled for Control blocks, the DeltaV system automatically identifies process models.
In the Modules area, you can elect to show all modules in the Modules list or only those modules that have at least one block that exceeds a limit (either for average variability or percent of time that the mode, control, or input was abnormal).
In the Report area, you can elect to show data for all modules and blocks or only for modules and blocks with reports enabled.
In the Priority area, you can display data for modules and blocks based on the priority selection: All Priorities, Priority 1-4, Priority 1-3, Priority 1-2, and Priority 1.
In the Device Filters area, select whether you want to see data for all devices, only devices in alert, only fieldbus devices in alert, or none.
Setting Limits
Limits used by InSight are, in some cases, set on individual blocks while other limits globally apply to all input, output, and control blocks in the system. If one or more blocks in a module has exceeded one of the limits, the problem is indicated by an icon on the Summary page. Select a block in the Inspect hierarchy or double-click a block on the Summary page to see block limits.
The limits under Control Conditions are global limits for all blocks. The limits under Performance Indices are per block. The Performance Index Limits Utility can be used to set performance limits on multiple blocks.
Setting Limits on Individual Blocks
The limits for the performance indices: Standard Deviation, Oscillation Index, Variability Index, and Tuning Index are by block. The Tuning Index indicates the potential for improving control performance by updating controller tuning according to the adaptive model and users' tuning requirements. The Oscillation Index defines how a PV's signal resembles the oscillatory signal. The defaults are:
If you have Tune privileges you can change these limits. To change a limit, click the limit you want to change and modify it in its cell.
Setting Global Limits
For all blocks, a default limit of 10% is provided for Incorrect Mode, Limited Control, Uncertain Input, Large Variability, Oscillation, Tuning, and Device Alerts. If you have tune privileges, you can change these limits using the Global Limits for Inspect Statistics dialog. Be aware that these limits affect all input, output, and control blocks and not just the selected block. Click to open this dialog.
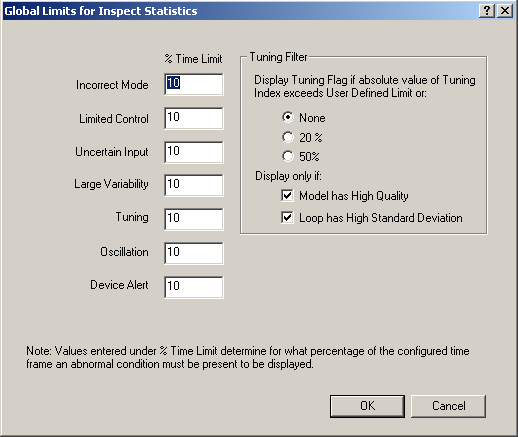
Percent time limits are used only when the time filter is set to current and previous hour, shift, and day. When Current and Previous are selected as the time filter, Inspect indicates an abnormal condition on the Summary tab when the abnormal tuning condition exceeds the percent (%) time limit. For example if the percent (%) time limit is set to 10%, the abnormal tuning condition must have existed for more than six (6) minutes in the previous hour before Inspect indicates it as an abnormal condition on the Summary tab. When Now is selected as the time filter and an abnormal tuning condition occurs, Inspect indicates the condition regardless of how long the condition existed.
Percent time limits detect when blocks are not operating as expected for too long a period of time. Limits can be set on:
- Incorrect mode - the percent of time the mode is incorrect (not in the configured Normal mode)
- Limited control - the percent of time the control is Limited
- Uncertain input - the percent of time the block PV is Bad, Uncertain, or Limited
- Large variability - the percent of time the Variability Index exceeds the block-specific Variability Index limit
- Tuning - the percent of time the Tuning Index exceeds the block-specific Tuning Index limit
- Oscillation - the percent of time the Oscillation Index must exceed the block-specific Oscillation Index limit
- Device alert - the percent of time that a device alert must be present
The Tuning Filter section is used to determine when tuning recommendations are displayed in InSight. Each PID block with Pprocess Learning enabled has a Tuning Index and Tuning Index Limit parameter (ADP_TUN_IDX_LIM). An abnormal tuning condition exists when the value of the Tuning Index exceeds the block's Tuning Index Limit value. The Tuning Filter selections are:
- None - Inspect displays abnormal tuning based on each block's Tuning Index Limit (ADP_TUN_IDX_LIM) value
- 20% - Inspect displays abnormal tuning for all blocks when the Tuning Index 20% regardless of the Tuning Index Limit (ADP_TUN_IDX_LIM) value
- 50% - Inspect displays abnormal tuning for all blocks when the Tuning Index 50%
The options under "Display only if" are additional filters that enable you to refine the tuning filter selections:
- Model has High Quality - Inspect displays abnormal tuning only based on High Quality models and if the tuning index meets the criteria specified in the Tuning Filter selection (None, 20%, 50%)
- Loop has High Standard Deviation - Inspect displays abnormal tuning only if the loop exceeds its high standard deviation limit and if the tuning index meets the criteria specified in the Tuning Filter selection (None, 20%, 50%)
Global limits for percent time abnormal are set or changed from the Inspect clients but are stored in the server. All clients use the same set of global limits, regardless of which client set them. Block specific limits for detection of high Standard Deviation, Variability Index, Tuning Index, and Oscillation Index are stored in the associated block.
Using the Performance Index Limits Utility
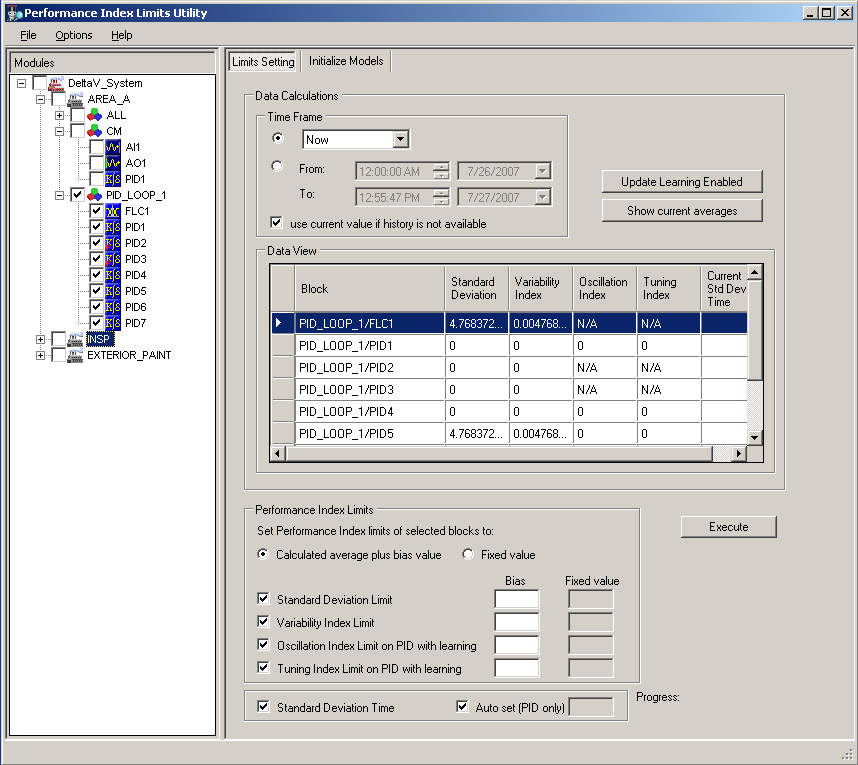
The Performance Index Limits Utility is used to set limits on the performance indices (Standard Deviation, Variability Index, Oscillation Index, and Tuning Index) on multiple PID blocks with Process Learning enabled. It can also be used to set the standard deviation time on PID blocks. Performance limits can be set to a calculated average plus a user-specified bias value or to a user-specified fixed value. For standard deviation time on PID blocks, the performance limit can be set through a user-specified fixed value or automatically by the application. Click to open this utility:
Selecting Blocks
Select the blocks from the hierarchy in the left pane. You can select all blocks in all areas in the DeltaV system, all blocks in all modules in a selected area, all blocks in a module, or individual blocks. In the preceding image, all blocks in the module PID_LOOP_1 are selected. To select an individual block, expand the hierarchy under the area and module containing the block. Click the check box to the left of an item to select it. A check mark indicates the item is selected.
Selecting Limits
After you select the items in the hierarchy, select the limits that you want to change in the Performance Index Limits section. You can click the Show current averages button to display the current averages in the Data View table. The Show current averages button is not enabled until a limit is selected in the Performance Index Limits area. The following image shows the Performance Index Limits area.
Selecting the Time Frame
Select the time frame from which data calculations are made. If history is not available for a block, you can specify that the current value is used.
Setting Performance Limits
There are two ways to set performance limits:
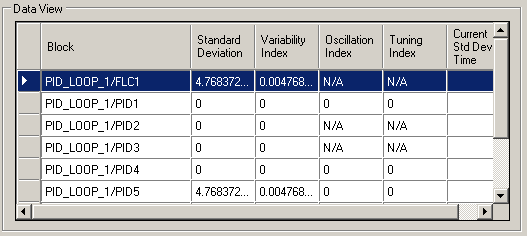
To set a performance limit, select either the Calculated average plus bias value option or the Fixed value option, select the limits that you want to change in the Performance Index Limits area, click the Show current averages button to display the current averages, specify a bias value or fixed value, and click the Execute button. The newly calculated limits are shown in the data view table which is shown below.
Setting a Standard Deviation Time
For standard deviation time on a PID, the choices are:
To set the standard deviation time on a PID, select the Auto set option or deselect this option and specify a bias value. When the Auto set option is selected, the utility determines the appropriate value to use. If the PID block has Process Learning enabled, the value for the Auto set option is BLOCK\ADP_TSS; if process learning is not enabled, the value for the Auto set option is BLOCK\RESET*4. Click the Execute button after entering a bias value or selecting Auto set. The newly calculated limit is shown in the Data View area.
The average standard deviation calulated by the PID block is zero if an SP-PV Track option such as SP-PV Track in LO or IMan is selected for the PID block's CONTROL_OPTS parameter.
Understanding the Status Icons
Icons in the hierarchy indicate the status of the limit setting. A green check mark indicates complete success and the red X indicates the failure of at least one limit setting. You can double-check the icons to see a result summary of which limits failed and which succeeded.
You cannot change limit settings on nodes with a status icon. You must first clear the image. To clear an image, select it and click Clear State Image from the context menu.
Use the Update Learning Enabled button on the Performance Index Limits Utility to update the PID block's ENABLE_LEARNING parameter.
Use the Initialize Models tab to re-initialize the selected blocks to the last approved model.
Deleting Module Assignments from Controllers
If you need to delete module assignments from controllers in your configuration the recommended way is:
If you attempt to remove module assignments from your configuration by deleting the assignment to a controller, then performing a total download, you must download the controller twice (total download followed by ) to prevent the InSight user interface from displaying modules that have not been completely removed from the controller. This additional download is necessary because of the way the system manages module assignments and deletions during the download process.
Variability Limits
Variability Index shows a control loop performance relative to the best possible performing loop (Minimum Variance Control Loop). In theory, a perfectly tuned loop has Variability Index close to zero. It should be noted, however, that minimum variance control is neither achievable in real control loop nor desirable to achieve. At perfect minimum variance control, a control loop experiences excessive movement of the controller output and has a rather narrow stability margin. Variability Index close to one hundred percent (100%) indicates an extremely poorly tuned loop. To achieve a compromise between as low as possible variability and reasonable loop stability margin, Variability Index of around fifty percent (50%) should be satisfactory for most loops. Fine adjustment of Variability Index limits should be determined based on the loop performance when it is correctly tuned.
Printing
When you select either the Print icon or , a dialog appears from which you can print either an active module summary report or a detail report on the local workstation printer or the selected network printer. The active module summary report contains the Performance Index, Control Utilization, total number of active modules, and the number of modules with one or more blocks that is in an incorrect mode or has Limited Control, Uncertain input, or large variability. The detail report contains the Percent Time Abnormal, Average Standard Deviation, and Average Variability Index for each I/O or Control block for the selected Time Frame.
Defining an Inspect Operator Interface
The DeltaV system includes two items you can use to create ways for operators to interact with InSight: the Inspect function block and the Inspect dynamo.
Use the Inspect dynamo in the DeltaV system to include InSight utilization calculation results in operator displays. When you insert the dynamo in a display, it prompts you for the tag of an Inspect block. The dynamo also shows the area over which the calculations are made and a button operators can use to enable and disable the calculations for the area. The following figure shows how the Inspect dynamo appears in a display.
From the dynamo, an operator can enable or disable InSight calculations for the area named in the dynamo. The two fields on the dynamo show the calculated performance and utilization for the modules in the area. The background color of these fields is invisible if the data status is good, orange for uncertain status, red for bad status, or magenta when data is not being communicated.