This image calls out the areas on PredictPro's main screen. A description of each area follows the image.
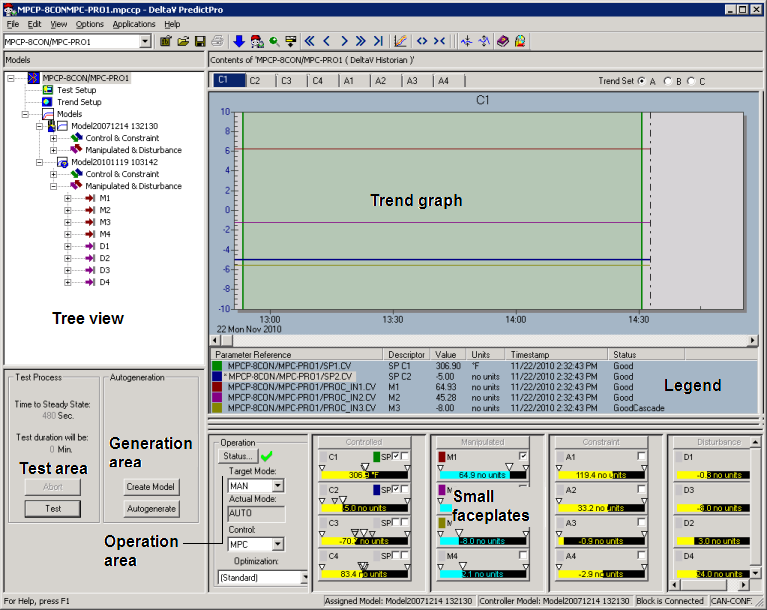
Tree View
The Tree View provides access to the Test Setup, Trend Setup, and Model views. Click the plus signs to move through the various levels in the tree. Select a level to view information about that level.
Several icons are used to provide warnings about the current status of the model. The icons appear next to the model name in the Tree View. Select a model and read the Warning message at the bottom of the Model Contents page for an explanation of the icon.
Trend Graph
The trend graph plots the MPCPro block parameters that have been assigned to the Continuous Historian. To set up the graph, click Trend Setup in the Tree View. Up to six inputs and outputs can be trended at one time. You can scroll the graph time scale forward and back in time, increase and decrease the time span, and expand and compress the amplitude of a trend line.
Legend
The Legend provides information about the parameter references and helps you to read the graph. Right-click a parameter in the Legend to modify the Y axis and scale, change the trend color and plot method, and scroll the trend forward and backward in time.
Test Area
Enter the value for Time to Steady State and click Test to begin the test. The progression bar shows the portion of the test that is complete and the estimated time remaining to complete the test is shown below the progression bar. To stop a test, click the Abort button.
Generation Area
When the test completes, use the green bars to select the data that you want to use to create the model and click Autogenerate to generate a model and control from the selected data and to automatically assign the model to the MPCPro block. Download the controller to put the model online.
Be sure that the module containing the MPCPro function block is not open in Control Studio when you click Autogenerate because the block is updated during autogeneration.
In Expert mode, the Create Model button is available. Click this button to automatically create and display a model from the selected data. The model is not assigned to the block and no control is generated.
Operation Area
Use this area to select an objective, target mode, and a control option (MPC or Local). MPC causes the output of the MPCPro block to provide the setpoint for the downstream block. Local causes the downstream block's local control strategy to take effect. In order for the Actual mode to go to Target mode, you must select MPC.
Small Faceplates
Shows up to 16 variable faceplates (maximum of four faceplates for each Controlled, Constraint, Manipulated, and Disturbance variable). To add or delete a parameter reference from the graph and Legend, check or clear the check box on the faceplate. To change a manipulated parameter value during testing, right-clickx, and then select Set Value. To find a trend with a specific parameter right-click the faceplate of the parameter that you want to find and select Find Trend.