Multi-Point element
Multi-point element
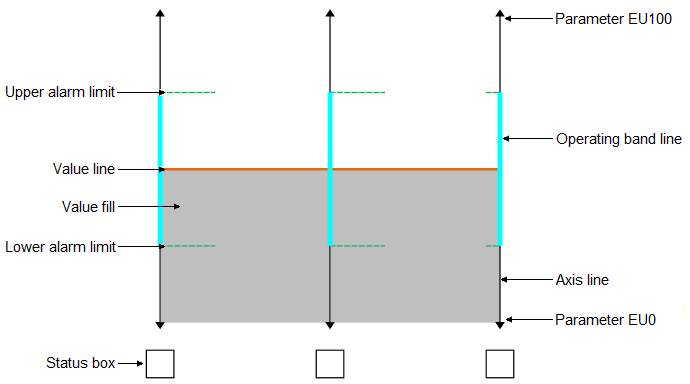
- Alarm limits
-
The alarm limits visualize the upper and lower alarm limit boundaries defined for that parameter.
- Axis line
-
The axis line visualizes the mapped parameter. When the current value moves outside the scale range, an arrow appears at the end of the axis line.
- Operating band line
-
The operating band line visualizes the operating range defined for that parameter.
- Operating band fill
-
The operating band fill visualizes
- Parameter EU0 and EU100
-
EU0 and EU100 visualize the scale range defined for that parameter.
- Status box
-
The status box indicates the status of the data quality. If an operating range is configured for a plot value, and the current value moves outside the operating range, the status box fills with the color configured for operating range violations.
The status box also shows alarm icons when a module is in an alarm state.
- Value line and value fill
-
The value lines connect at the point where the current value of each parameter is plotted on its axis.