-
Click
Display Port Statistics on the context menu.
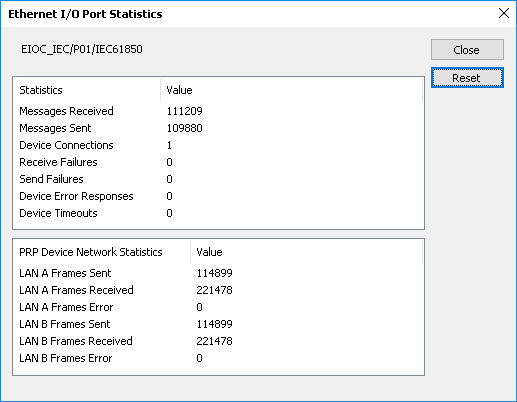
The system displays the Ethernet I/O Port Statistics
dialog. All values in the dialog are cumulative. The
Reset button resets the values to zero.
 Device Connections and protocol type
When the protocol type of the device network port is:
- Ethernet/IP: The number of device connections reported represents the number of separate connections needed to service all logical devices under the physical device. An Ethernet/IP device network port can have multiple messaging classes (Class 1 Implicit, Class 3 Explicit, Class 3 with PCCC, or UCMM with Logix tags). Therefore, the number of connections reported will be greater than or equal to the number of physical devices configured and less than or equal to the number of logical devices configured.
- Modbus TCP: Each device connection reported corresponds to an IP address for a physical device; therefore, a simplex device reports one connection, while a device configured for redundancy reports two connections.
- IEC 61850: Each device connection reported corresponds to a simplex physical device; redundant IEC 61850 devices are not supported.
- OPC UA: The number of device connections reported corresponds to each endpoint URL of a physical device; therefore, a simplex device reports one connection, while a device configured for redundancy reports two connections.
- Ethernet/IP Control Tag Integration: The number of device connections reported represents the number of separate connections needed to service all logical devices under the physical device. The logical devices of an Ethernet/IP Control Tag Integration physical device will attempt to share connections where possible; therefore, the number of connections will be greater than or equal to the number of physical devices configured and less than or equal to the number of logical devices configured.
PRP Device Network
The image above shows device statistics for a port with Parallel Redundancy Protocol enabled. LAN A indicates the left side (primary). LAN B indicates the right side. The statistics indicate the following:- Sent: The number of messages sent on each interface.
- Received: The number of messages received on each interface that include a PRP header. All PRP messages include a header that indicates the LAN on which the message was transmitted. Messages received only appear in these counts if the messages include this header.
- Error: The number of received messages that contain an error. This can indicate messages received on the wrong network (that is, the LAN indication in the PRP header does not match the physical LAN on which the message was received). Counts generally indicate a crossed network in the PRP network topology.