The RMT_SPM_FP faceplate is used with the RMT_SPM_HART and RMT_SPM_FF library module templates. The faceplate shows the values and bar graphs for two different AI function block variables. The left bar graph is the value of either the PV or the MEAN function block, as determined by the FP_VAR_1 (Left Operator Variable) parameter in the control module. The right bar graph is the value of either the STDEV or the CV function block, as determined by the FP_VAR_2 (Right Operator Variable) parameter. See Statistical Process Monitoring Module Template help for more information. If either the FP_VAR_1 or FP_VAR_2 parameter are changed to display a different variable, the faceplate must be closed, and reopened, in order to display the newly assigned variable on the bar graph.
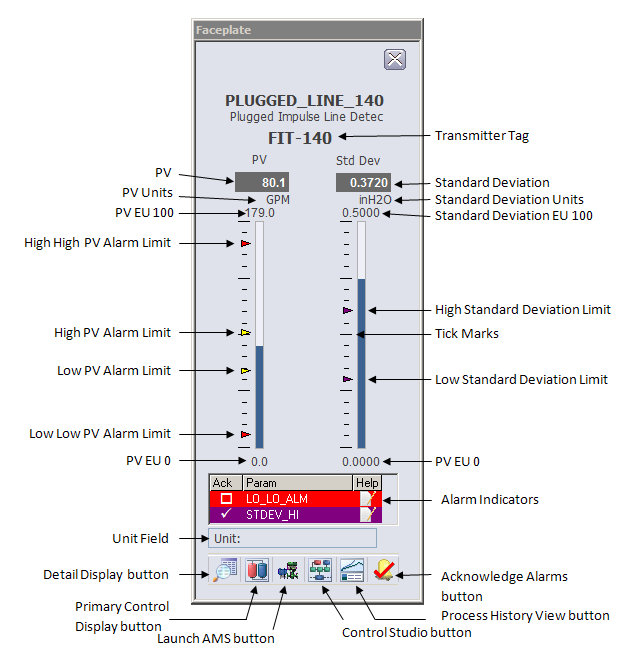
- Transmitter Tag - Tag of the transmitter providing SPM data to this module. This tag must be specified in the DEVICE_TAG parameter of the module.
- PV - This field displays the OUT value from either the PV or the MEAN function block, as specified in the FP_VAR_1 parameter. The background color of the 3-D box changes from gray to orange or red when the PV status becomes uncertain or bad, respectively. The PV or MEAN value is visible in the decimal format provided by OUT_SCALE.DECPT.
- PV Units - This area provides the engineering units description used for the PV or MEAN as defined in the OUT_SCALE parameter.
- PV EU 100 - This value corresponds to 100% of scale for the PV (or MEAN).
- PV EU 0 - This value corresponds to 0% of scale for the PV (or MEAN).
- PV Bar Graph - This field indicates the value of the PV (or MEAN) function block, which is the same as the value shown in the PV display box.
- Standard Deviation - This field displays the OUT value from either the STDEV or the CV function block, as specified in the FP_VAR_2 parameter. The background color of the 3-D box changes from gray to orange or red when the Standard Deviation status becomes uncertain or bad, respectively. The displayed decimal format of STDEV or CV is determined by the OUT_SCALE.DECPT parameter field.
- Standard Deviation Units - This area provides the engineering units description used for the STDEV or CV, as defined in the OUT_SCALE parameter.
- Standard Deviation EU 100 - This value corresponds to 100% of scale for STDEV or CV.
- Standard Deviation EU 0 - This value corresponds to 0% of scale for the STDEV or CV.
- Standard Deviation Bar Graph - This field indicates the value of STDEV or CV, which is the same as the value shown in the Standard Deviation display box.
- Tick Marks - Use this vertical arrangement of black lines to indicate percentages of PV/MEAN and STDEV/CV.
- PV Alarm Limits - These arrowheads are vertically positioned relative to the PV bar graph to indicate the High High, High, Low, and Low Low Alarm Limits for the PV, or the High and Low Alarm Limits for the MEAN. The alarm limit values they indicate can be modified by using the module's detail display. Only alarms that are enabled have a corresponding arrowhead displayed. The color corresponds to the alarm priority.
- Standard Deviation Alarm Limits - These arrowheads are vertically positioned relative to the Standard Deviation bar graph to indicate the High and Low Alarm Limits for the STDEV or CV. The alarm limit values they indicate can be modified by using the module's detail display. Only alarms that are enabled have a corresponding arrowhead displayed. The color corresponds to the alarm priority.
-
Alarm Indicators - This is a scrollable list of the current
alarms in the control module. The list functions like the first two columns of
an alarm summary. The first column shows the state of the alarm represented by
one of the following symbols:
The second column is the alarm name or parameter. The text and colors are as configured for the alarm's current state.
- Unit Field - This field displays the unit name.
- Toolbar - Click the
icons from left to right to perform the following functions, respectively:
- Detail Display button: open the detail display for the control module.
- Primary Control Display button: open the primary control display.
- Launch AMS button: opens the AMS Device Manager Overview or Configuration screen for transmitter providing SPM data to this control module. The DeltaV tag of the transmitter must be specified in the DEVICE_TAG parameter of the module.
- Control Studio button: open Control Studio.
- Process History View button: opens the DeltaV Process History View, and displays a trend of the two variables (PV or MEAN and STDEV or CV) shown on the faceplate.
- Acknowledge Alarms button: acknowledge all alarms on this module.