When you select a model node in the hierarchy, the Neural application shows the sensitivity plots that correlate each of the inputs to the model's output. The appearance of the Configuration View depends on whether the model has been trained or not and whether you have selected the Normal or the Expert option.
The following figure shows the view for an untrained network with the Expert option selected.
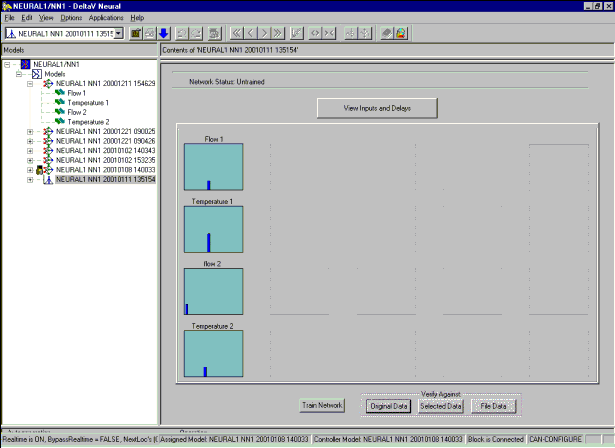
A red X on a sensitivity plot indicates that the input has no or insignificant influence on the output and that it is not useful for training. A thick vertical bar on a plot indicates the sensitivity of the input at a particular delay. The position of the bar corresponds to the identified delay and the length of the bar reflects its sensitivity value. The dashed yellow horizontal line is the average sensitivity value for the given configuration.
Double-clicking any of the graphs opens a detailed view of the selected sensitivity plot.