An expert user with a good knowledge of the delay and time constants associated with inputs to the process can modify individual sensitivities, if required.
-
Open an individual sensitivity analysis.
The application opens a detailed view of the graph.
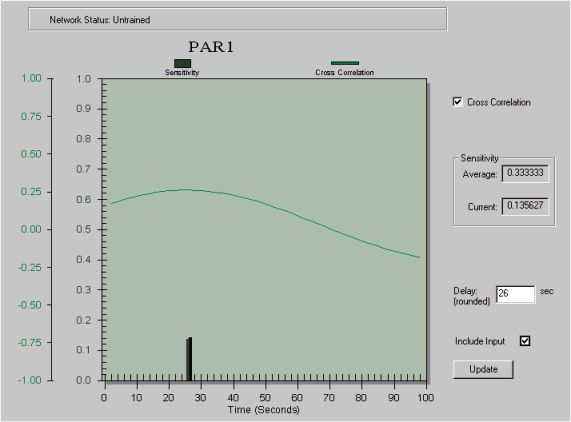
Each analysis shows the sensitivity of the output to an input and the time at which the input has maximum influence on the output. This time is known as the Delay. The maximum possible delay is the Time to Steady State for the model.
The sensitivity value (normalized, where the sum of all sensitivities equals 1.0) is shown as a bar at the Delay value. The numeric sensitivity value and the average sensitivity value (1/number of input references) is also shown. Optionally, the cross correlation between the input and output is shown when the corresponding box is checked.
If the input has not changed, has no influence on the output, or the sensitivity is below the threshold (20% of the average sensitivity), DeltaV Neural automatically excludes the input and it is not used for training. A red X appears on the Sensitivity graph, the Use Input box is unchecked, and the Delay is set to -1.