- Level 1 displays present an at-a-glance overview of the control process within an operator’s scope of responsibility. These displays show the lowest level of process or system detail. The information presented here aids operators in identifying, processing, and comprehending the critical elements of a plant's operations.
- Level 2 displays allow the operator to drill down into smaller portions of the areas they are responsible for. These displays present information that aids operators in monitoring and operating the elements they are responsible for on a daily basis. For example, an operator may be responsible for operating multiple process units. Level 2 displays provide a process unit level overview for each of those units.
- Level 3 displays allow operators to drill down into subsystems, showing a portion of a level 2 display with an increased level of detail.
- Level 4 displays are used for diagnostics and show equipment or systems related to level 3 displays in greater detail, such as faceplates or detail displays.
Situational awareness can also be increased by displaying information in such a way that predictable patterns emerge (such as grouping or arranging on-target values in a particular way). This helps operators know at a glance if their process is within normalcy and to quickly identify severe deviations from target as well as other problems that may occur in the process.
frsModules_HighPerf dynamos
To support ISA's display optimization recommendations, DeltaV Operate provides a set of high performance dynamos (frsModules_HighPerf dynamos) that are designed to improve operators' situational awareness on level 1, level 2, and level 3 displays. These dynamos contain the salient information needed for operators to perform their duties during normal operations. High performance dynamos configured for level 1 displays have few salient features, while dynamos configured for level 2 and 3 present increased salience for when deviation or abnormal conditions occur.
These high performance dynamos utilize consistent, repeated patterns so that operators can more easily identify deviations from target. They are also designed to support emergent patterns by grouping or stacking several dynamos together. These dynamos use the Theme_Colors threshold table in frsVariables.
| Dynamo | Function block | Level |
|---|---|---|
| High Performance Horizontal Analog Bar
(HP_HorizAnalog) |
PID, AI, AO, ALM, MANLD, RTO | 1, 2 |
| High Performance Vertical Analog Bar
(HP_VertAnalog) |
PID, AI, AO, ALM, MANLD, RTO | 1, 2 |
| High Performance Control Valve
(HP_C_Valve) |
PID, MANLD, AO | 1, 2 |
| High Performance Block Valve
(HP_B_Valve) |
DC, EDC | 1, 2 |
| High Performance Pump
(HP_Pump) |
DC, EDC | 1, 2 |
| High Performance Numerical Value
(HP_Numeric) |
PID, AI, AO, ALM, MANLD, RTO | 1, 2 |
| High Performance Unit Alarm Indicator
(HP_Alarms) |
n/a This dynamo is mapped to an Area. |
1, 2 |
| High Performance Radar Plot
(HP_Radar) |
Any | 1, 2 ,3 |
| High Performance Horizontal MultiPoint
HP_HorizMultiPoint |
Any | 1, 2 , 3 |
| High Performance Vertical MultiPoint
HP_VertMultiPoint |
Any | 1, 2 , 3 |
| High Performance AT Valve
(HP_AT_VLV_) |
PID | 3 |
| High Performance EDC Pump
(HP_EDC_PMP_) |
EDC | 3 |
| High Performance EDC Valve
(HP_EDC_VLV_) |
EDC | 3 |
| High Performance Tag integration
(HP_M1_CH_S_) |
TAGAI, TAGAO, TAGDI, TAGDO | 3 |
| High Performance MA1_CH_ analog
(HP_MA1_CH_) |
PID | 3 |
| High Performance MA1_DH_ analog
(HP_MA1_DH_) |
PID | 3 |
| High Performance MA1_N_ analog
(HP_MA1_N_) |
PID | 3 |
| High Performance MA1_VLV_ analog
(HP_MA1_VLV_) |
PID | 3 |
| High Performance MA2_DH_ analog
(HP_MA2_DH) |
PID | 3 |
| High Performance MA2_DV_M_ analog
(HP_MA2_DV_M_) |
PID, ALM | 3 |
| High Performance MA2_DV_S_ analog
(HP_MA2_DV_S_) |
PID, ALM | 3 |
| High Performance MA3_CH_ analog
(HP_MA3_CH_) |
PID, AI, ALM | 3 |
| High Performance MA3_CV_M_ analog
(HP_MA3_CV_M_) |
PID, AI, ALM | 3 |
| High Performance MA3_CV_ML_ analog
(HP_MA3_CV_ML) |
PID, AI, ALM | 3 |
| High Performance MA3_CV_S_ analog
(HP_MA3_CV_S_) |
PID, AI, ALM | 3 |
| High Performance MA3_CV_SL_ analog
(HP_MA3_CV_SL_) |
PID, AI, ALM | 3 |
| High Performance MA3_N_ analog
(HP_MA3_N_) |
PID, AI, ALM | 3 |
| High Performance MD1_PMP discrete
(HP_MD1_PMP_) |
DC | 3 |
| High Performance MD1_VLV discrete
(HP_MD1_VLV_) |
DC | 3 |
| High Performance SHDI module
(HP_MSHDI_) |
SHDI | 3 |
| High Performance SHDO module
(HP_MSHDO_) |
SHDO | 3 |
The following section describes all of the elements that may be present on the frsModules_HighPerf dynamos when customizing them. When configuring the dynamos for level 1 or level 2 displays, see the individual dynamo topic for the elements available on each level.
frsModules_HighPerf dynamo elements
- Abnormal status icons
- The following describes the possible status icons for the
frsModules_HighPerf dynamo set.
- Abnormal status indicators
- Alerts the operator that a condition needing attention exists (abnormal status). This status indicator appears in the same place as the alarm icon. When no active alarms exist, the abnormal status indicator [show icon] is fully visible. When active alarms do exist, the abnormal status indicator is partly visible and wraps around the alarm icons. The color of the status box is based on the named Status border color in the Theme_Colors table.
- Alarm box
- The dynamo is surrounded by a thick colored rectangle at run time when a module alarm is active or unacknowledged. The color corresponds to the highest priority alarm color. When a dynamo is selected, it is surrounded by a slightly larger thin rectangle.
- Alarm count
- Shows the total number of unacknowledged alarms, active alarms, and suppressed alarms for the specified area, unit, or parameter.
- Alarm icons
- Shows the highest priority alarm for that module. The suppressed
alarm icon
 is visible if there is a
suppressed alarm (that would otherwise be active) and there are no other active
or unacknowledged alarms.
is visible if there is a
suppressed alarm (that would otherwise be active) and there are no other active
or unacknowledged alarms.
- Alarm label
- A user-configured label (up to 16 characters) that appears inside the dynamo.
- Alarm limits
- Visualization of the alarm limits defined in the control module.
- Click to open faceplate
- Clicking anywhere on the dynamo opens the module's defined faceplate. This leaves only important process data in the dynamo and provides less clutter for the operator.
- Presents PID, AI or ALM information graphically, relative to the
defined high and low scale defined in the dynamo. This allows operators to scan
a display and understand their approximate values and position in range without
needing to read the corresponding numerical values.
The combination bar graph indicates the relative values of PV, SP, SP_WRK, and alarm limits (when the corresponding alarm is enabled), based on the defined range. By default, the range used is PV_SCALE (OUT_SCALE for AI blocks). The SP and SP_WRK indicators are hidden when the function block definition is the AI block.
Optionally, a user-defined scale can be configured. The user-defined scale can be defined as values, such as low range = 20 and high range = 80 or can be defined by paths, such as LO_LIM and HI_LIM. When paths are configured for the range, the range will dynamically adjust in runtime based on the current value of those paths.
Operators are provided indication that the dynamo is based on user-defined scales. When user-defined scales have been configured for the dynamo, it is indicated with perpendicular lines shown at the ends of the combination bar graph. Perpendicular lines are shown at both ends of the bar graph to indicate that a partial range is defined.
NoteWhen setting the user-defined scale high and low limits to a parameter path, validity of those values cannot be checked.
The combination bar graph graphically shows the following key information:
-
Comparison of PV and SP - Shape recognition is used to aid detection. When PV is equal to SP, the PV bar touches the perpendicular SP bar, forming a 'T'. If the PV is above SP, a 't' is shown. Knowing these shapes allows the operator scan a display and quickly know how PV and SP compare.
-
Comparison of PV and SP, when operation is limited to a small portion of the full range - the user-defined scaling can be defined such that even a small differences between PV and SP is very visible within the range defined. For example, a temperature bar graph may only show the range of 740 - 755, because this is the range the temperature is normally operated within. The full PV_SCALE may be 0 to 800.
-
Comparison of PV and SP to SP_WRK - When SP_WRK is different from SP, it is shown on the bar graph. This allows operators to recognize the situation where PV is not equal to SP because SP_WRK is active and the currently displayed SP value is not being used by the module.
-
PV and SP relative range - Operators are shown PV and SP are at the appropriate place in range. By default, the full 0 - 100% PV_Scale (OUT_SCALE for AI) range is shown in the graph. For process values such as temperature or pH where operation is required within a small percentage of the overall range, the bar graph can be defined with a partial range.
-
PV and SP value relative to alarm limits - HI, HIHI, LO and LOLO Alarm limits are shown on the bar graph. If the PV or SP is near an alarm limit, the operator can determine this from the combination bar graph. The indication of these alarm locations is shown subtly (such as in grays), providing alarm limit information without being distracting or creating excessive visual clutter.
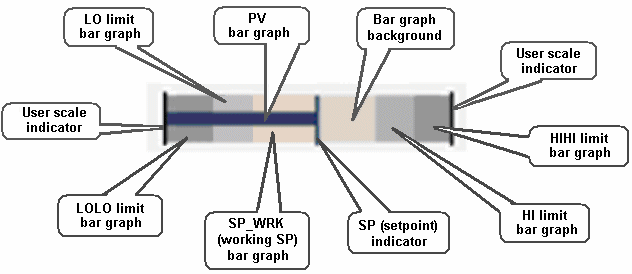
The combination bar graph:- has two bar graphs for LO and LOLO limits filling from the left (or bottom, depending on the orientation).
- has two bar graphs for HI and HIHI limits filling from the right (or top, depending on the orientation).
- uses Alarm 1 color for HI and LO.
- uses Alarm 2 color for HIHI and LOLO.
- has PV bar graph, SP indicator, and SP_WRK bar graph (invisible when SP_WRK=SP).
- has an indication that is visible at run time if the scale is user-defined.
- sets the color based on the PV foreground color in the Theme_Colors table (the background is transparent).
-
- Display tag
-
A single field of 16 text characters that appears at the top or on the side of the dynamo. The display tag displays one of the following: If no friendly name is configured for the dynamo, the module name is shown instead. The operator can toggle the tag's visibility on and off at runtime using the Toggle Display Tag toolbar button. Display Options on the Toggle Display Tag include:
The Toggle Display Tag toolbar button appears on the toolbar of all monitors and the operator action applies to all monitors. That is, the operator cannot choose to show the module name on one monitor and the module description on another.
The tag's text color is based on the Text Background 4 color in the Theme_Colors_FP_DD table.
- Dynamo background
- The dynamo's background color is based on the named dynamo background color in the Theme_Colors table. The dynamo background is smaller when the alarm and status boxes are not visible. The dynamo background is highlighted (surrounded by a slightly larger thin rectangle) when the dynamo is selected and the module's faceplate is open.
- Description
- A single user-configured field that appears at the bottom center of the HP_Radar dynamo.
- Dynamo hotspot
- The dynamo is surrounded by a hotspot that allows certain
actions when hovering on it. The actions are:
- For all dynamos in the frsModules_HighPerf dynamo set, clicking on the hotspot opens the module's defined faceplate.
- For dynamos configured for level 1 and level 2 displays, hovering on the hotspot displays an information hover window that provides more information about the dynamo.
- Dynamo selection
-
A selection box around the dynamo indicates that the dynamo is currently selected. Dynamos are selected whenever the dynamo is clicked or its faceplate is active.
- Engineering units descriptor (EU)
- It shows the A_UNITS field of the applicable scaling parameter; PV_SCALE when the function block definition is PID or ALM; and, OUT_SCALE when the function block definition is AI. The field is left justified in horizontal applications and center justified in vertical applications. The EU descriptor is shown adjacent to PV data fields only. The text color is based on the named Tag EU color in the Theme_Colors table.
- Info box
- Perform one of the following mouse events on the info box to view more information:
- Information hover window
- Operators can hover on the dynamo's
hotspot to display a popup window that
provides more information about the dynamo. This hover window can be toggled on
and off at runtime using the
Toggle Display Tag toolbar button. The hover
window provides some or all of the following information, depending on the
dynamo:
Information/Data HP_HorizAnalog
HP_VertAnalog
HP_C_Valve HP_B_Valve HP_Pump HP_Numeric HP_Alarms Module name YES YES YES YES YES NO Module description YES YES YES YES YES NO Mode YES YES YES YES YES NO PV and SP values YES YES YES YES YES NO OUT value YES YES NO NO YES NO Alarm limits (HIHI, HI, LO, LOLO) YES YES NO NO YES NO Abnormal status icons YES YES YES YES YES NO Alarm label NO NO NO NO NO YES Total alarms NO NO NO NO NO YES Top alarm NO NO NO NO NO YES Alarm state NO NO NO NO NO YES Ramp status YES YES NO NO YES NO Notes- When the following
conditions are true for the dynamo, the abnormal status icon is not part of the
dynamo's hotspot.
- The dynamo is configured to show alarm abnormal status indicators.
- The dynamo has no active alarms.
- The dynamo is in abnormal mode.
Therefore, you must hover on the dynamo itself to activate the hover window.
- When you copy a
dynamo from the frsModules_HighPerf dynamo set from one display and paste it
onto a new display, you must open and close a high performance dynamos's
configuration form on the new display. This allows the appropriate events to be
created and ensures the hover window functions appropriately.
If the new display contains multiple high performance dynamos, you can complete the dynamo setup for any one of them to prevent the hover window from remaining open.
- When the following
conditions are true for the dynamo, the abnormal status icon is not part of the
dynamo's hotspot.
- Labels
- Labels include the static strings PV, SP, and OUT where applicable (PID, AI and ALM dynamos with data). The color is per the named Tag EU color in the Theme_Colors table.
- Measuring point axis
- Each module is mapped on its own measuring point axis.
-
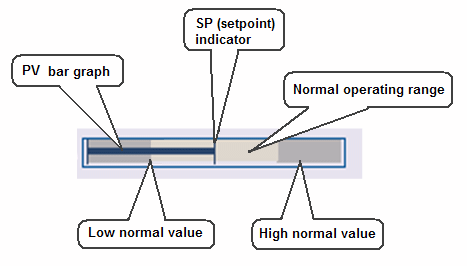
A horizontal bar that presents PID, AI or ALM information graphically relative to defined normal ranges of PV_SCALE (OUT_SCALE for AI). This graph is useful when it is important whether values are in the defined normal range. The normalized bar graph divides PV_SCALE (OUT_SCALE for AI) into three sections. The three sections are always shown as the same size, regardless of the percentage of the scale they represent. Thus, if several normalized bar graphs are stacked vertically, the normal sections line up, facilitating pattern recognition for value comparisons based on the defined normal ranges.
By default, the low normal value is defined by the block LO_LIM parameter and the high normal value is defined by the block HI_LIM parameter. Changing the alarm limit parameters adjusts the percentage of the scale in the three sections during run time. Optionally, user-defined parameters can be configured for the low and high normal values.
The normalized bar graph divides PV_SCALE (OUT_SCALE for AI) into three sections as defined by the High and Low Normal Values. For example, if the full scale is defined as 0 to 100, with LO_LIM equal to 10 and HI_LIM equal to 70, the three sections would be defined as 0 - 10, 10 - 70 and 70 - 100. PV and SP are positioned linearly within each section. Therefore, if PV was equal to 5, it would be shown at the midpoint of the low normal value section. If PV changed to 11, it would be shown on the left side of the normal value section. If PV changed to 40, it would be positioned at the midpoint of the normal section.
When additional information is needed with a normalized bar graph, a companion dynamo may be used. The SP indicator is hidden when the function block definition is the AI block.
The normalized bar graph:- Has a horizontal bar graph showing the relative goodness/badness of the process value to the operator
- Has the PV color for the center bar graph; and, the left and right bar graph are in the Alarm 1 color
- Ranges from EU0 to the min normal value on the left bar graph
- Ranges from the min normal value to the max normal value on the center bar graph
- Ranges from the max normal value to EU100 on the right bar graph
The normalized bar graph graphically shows the following key information:
-
Comparison of PV and SP - Shape recognition is used to aid detection. When PV is equal to SP, the PV bar touches the perpendicular SP bar, forming a 'T'. If the PV is above SP, a 't' is shown. Knowing these shapes allows the operator scan a display and quickly know how PV and SP compare.
-
Comparison of PV and SP - based on current defined operating ranges. This graph can be particularly useful when the portion of the range defined as normal often changes for a value and so it is less likely that the operator will know where the values should be relative to percent in range. Operators can scan the graph knowing that the values outside the normal operating range are consistently represented (that is, not in the fixed, normal section).
-
Monitoring of PV and SP when the normal operating range is a small percentage of the overall range - Since the normalized operating section is always shown the same size, the normalized bar graph can be used to show a small normal operating region as a large portion of the graph. For process values such as temperature or pH where operation is required within a small percentage of the overall range, the bar graph Normal Operating Region can be defined such that the operator has improved visibility to PV and SP movement within this region.
- Operating range
-
Visualizes the good range defined for the module parameter. The range is configured with a low value and a high value, each of which may be linked to parameters in the DeltaV System or given static values. The operating range may optionally be added to the HP_HorizAnalog, HP_VertAnalog, HP_Radar, HP_HorizMultiPoint, and HP_VertMultiPoint dynamos.
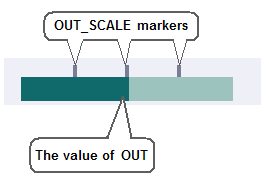
- Output bar
- Indicates the value of the function block's OUT in the range of OUT_SCALE by filling left to right. The output bar is visible by default but can be hidden using the Dynamo Properties dialog. The output bar and the valve body cannot both be hidden.
- Indicates the value of the PID block's OUT in the range of
OUT_SCALE by filling left to right. The scale markers above the bar graph are
optionally visible through a global variable object, which applies to scale
markers on all OUT bar graphs.
- Pump body
- The pump body has four possible orientations: right, left, up-right, and up-left. The pump base may optionally be hidden.
- PV and SP Data fields
-
The data values for PV and SP of the selected block. Up to six (6) right-justified digits including decimal point and minus sign if applicable. These fields are formatted based on the F_DECPT field of the PID block’s PV_SCALE. The text color is the same for both PV and SP and is based on the named Data Value color in the Theme_Colors table.
The font size of the data fields can be modified by adding a script that assigns a new value to the gn_dynamoFontSize global variable. The visibility of the data fields can be turned off by adding a script that assigns a new value to the gb_dynamoNumVisible global variable. The font size and visibility of the data fields can also be controlled at run time by the toolbar button:
 Toggle Display Tag.
- PV indicator
- HP_HorizAnalog and HP_VertAnalog: Visualizes the process value of the selected parameter. The process value may be linked to a function block PV or to another parameter in the DeltaV system.
- PV outside of visible range
- If the PV is outside the visible range (according to the scaling configuration), an arrow is shown at the end of the measuring point axis. This may happen if the scaling is configured manually.
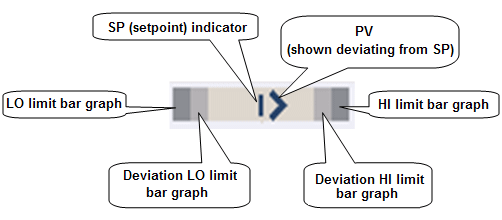
- Presents PID or ALM information graphically relative to the
current SP. This allows operators to scan a display and determine which modules
have significant deviations between PV and SP, without needing to read the
corresponding numerical values. The deviation bar graph compares the value of
PV and the value of SP and displays the deviation. The perpendicular line
representing SP does not move and is always in the center of the bar graph. The
greater the deviation, the more visible the PV diamond becomes.
The distance between PV and SP on a bar graph always represents the same amount of deviation from that SP, whether PV is above or below SP. Thus a 2% deviation between PV and SP places PV at the same location on the bar graph, whether PV is above, or below SP. Since SP is fixed in the middle of the bar graph, it is the current SP value that defines the current range of PV shown in the bar graph.
By default, the maximum configured bar graph range uses PV_SCALE. In runtime, the bar graph always uses this maximum. Since the SP value is always in the middle of the graph, when SP is set at 50% of range, the PV diamond at the end of the bar would indicate that PV was at 0 or 100% of PV_SCALE. If SP is then set to 25% of PV_SCALE, the PV diamond at the end of the bar graph would indicate that PV was at -25% or 75% of PV_SCALE. Note that, in this case, PV would be limited to 0 and the diamond would never reach the bottom of the bar graph range of -25%, because the PV value cannot be outside of the PV_SCALE range.
Optionally, you can have a user-defined maximum configured bar graph range. The user-defined percent of scale can be defined as either a number or a path that resolves to percent . If the value is set to 10, it equates to ±5% of EU range. So the maximum bar graph range would have zero scale at SP minus 5% of EU range and full scale on the bar graph is SP plus 5% of EU range for a total of 10%. When using a path, limit the value to between 0 and 100. When a path is configured for the range, the range will dynamically adjust in runtime based on the current value of that path.
The deviation bar graph graphically shows the following key information:
-
Comparison of PV and SP - Shape recognition is used to aid detection of PV deviations. When PV equals SP, only the perpendicular SP line is visible. The greater the deviation, the more visible the PV diamond becomes, starting as an arrow and growing into the diamond shape. Knowing these shapes allows the operator to scan a display and quickly know how PV and SP compare.
-
Pattern recognition to detect the significance of any PV deviations from SP is possible, when multiple deviation bar graphs are viewed together, since the SP indication is fixed.
-
Comparison of PV and SP, when small deviations are important - the user-defined scaling can be defined such that even a small deviation between PV and SP is very visible and provide this information for any SP value.
-
Operators are shown PV and SP at the appropriate place in range. By default, the full 0 - 100% PV_Scale range is shown in the graph. For process values such as temperature or pH where operation is required within a small percentage of the overall range, the bar graph can be defined with a partial range.
-
PV and SP value relative to alarm limits - HI, DV_HI, LO and DV_LO Alarm limits are shown on the bar graph. If the PV or SP is near an alarm limit, the operator can determine this from the combination bar graph. The indication of these alarm locations is shown subtly (such as in grays), providing alarm limit information without being distracting or creating excessive visual clutter.
-
- Ramp status icon
- In a Loop Ramp module containing an Enhanced Ramp (ERAMP)
function block, the
Ramp status icon in the lower right corner
of the dynamo indicates the current state of the ramp as indicated in the
following table:
- HP_Radar, HP_HorizMultiPoint, and HP_VertMultiPoint: — Right-clicking on a module's info box in runtime opens a context menu. From this menu, you can do the following:
- Status box
- The dynamo is surrounded by a colored rectangle at run time to
indicate that a condition needing attention exists when there are no active
alarms. The conditions that set the status icons and the suppressed alarm icon
also set the visibility of the status box.
The status box can be visible at run time when the alarm box is not visible. The status box is visible and a user preference applies. The dynamo can be configured to show or not show the status box when an applicable condition is active, including Bad IO, Module Not Running, Simulation Active, Analog Mode not as Expected and DC Mode not as Expected. The color of the status box is based on the named Status border color in the Theme_Colors table.
- Target indicator
- Indicates where the operating target for the PV falls on the bar.
The target may be linked to the function block SP, linked to another parameter
in the DeltaV System, or given a static target value. When the target is linked
to the function block SP, it is shown as a different color to indicate that the
loop is a controller rather than an indicator.
When the dynamo is configured for level 1, the target may optionally be normalized to 50%. When target is normalized, the Target indicator is shown in the center of the analog bar. In a normal operating scenario, the Target and PV appear aligned, forming a butterfly pattern on the analog bar. This makes it easy to identify when the PV deviates from the Target. The dynamo can show either a normalized target or the operating range, but not both at the same time.
- Valve body
- Indicates whether the valve is open or closed. The valve body has four possible orientations: 0°, 90°, 180°, and 270°.